News

The COVID-19 pandemic has not only disturbed international travel but has also affected domestic vacation tourism. Among three major vacation periods in Japan, which are New Year’s day (January), Golden Week (May), and Obon (August), Golden Week is definitely the most awaited vacation period in the year, as it is the period with the most consecutive holidays.
After the COVID-19 pandemic, the Government of Japan strongly discouraged people from traveling beyond the boundary of prefectures by declaring a state of emergency. While Golden Week (GW) in 2020 and 2021 required nationwide voluntary travel restriction (*1), 2022 was a year without any emergency declarations or other restrictions in any region. How has this unrestricted travel situation affected the number of domestic travelers in this country? We analyzed the changes using the LocationMind xPop's statistical data(*2) to check how Japan and each prefecture were affected.
(*1) In 2021, the state of semi-emergency was applied to Miyagi, Saitama, Chiba, Kanagawa, Aichi, Ehime and Okinawa, and the state of emergency was applied to Tokyo, Kyoto, Osaka and Hyogo. Ref:https://corona.go.jp/en/
(*2) “LocationMind xPop” Data refers to people flow data collected by individual location data sent from mobile phone under users‘ consent through applications such as “docomo map navi" service (map navi, local guide) provided by NTT DOCOMO, INC. The data is processed collectively and statistically in order to conceal the private information. Original location data is GPS data (latitude, longitude) sent at a frequency of every 5 minutes at the shortest interval and does not include information that specifies individuals.
The duration of GW varies from year to year: in 2021, it was 5 days; in 2022, it was 10 days. Considering this difference in the length of the period, as well as the fact that the amount of people moving during GW in 2022 is expected to be higher, we focused our analysis on the average number of people moving each day, rather than the total number of people moving during the entire GW period, because we believe that daily movement is more appropriate for comparison.
Meet Our LocationMind xPop© Dashboard for People Flow Analysis
Using data initially collected by NTT Docomo, LocationMind Inc. has developed the LocationMind xPop© Dashboard. This dashboard is designed to visualize the flow of human transportation and to understand how the situation in the COVID era is affecting the number of travelers in Japan. Using this dashboard, we observed the daily average number of people moving between prefectures.
|
>>>>>>>>> To learn more about LocationMind xPop©, please visit our page, or contact us. <<<<<<<<<< |
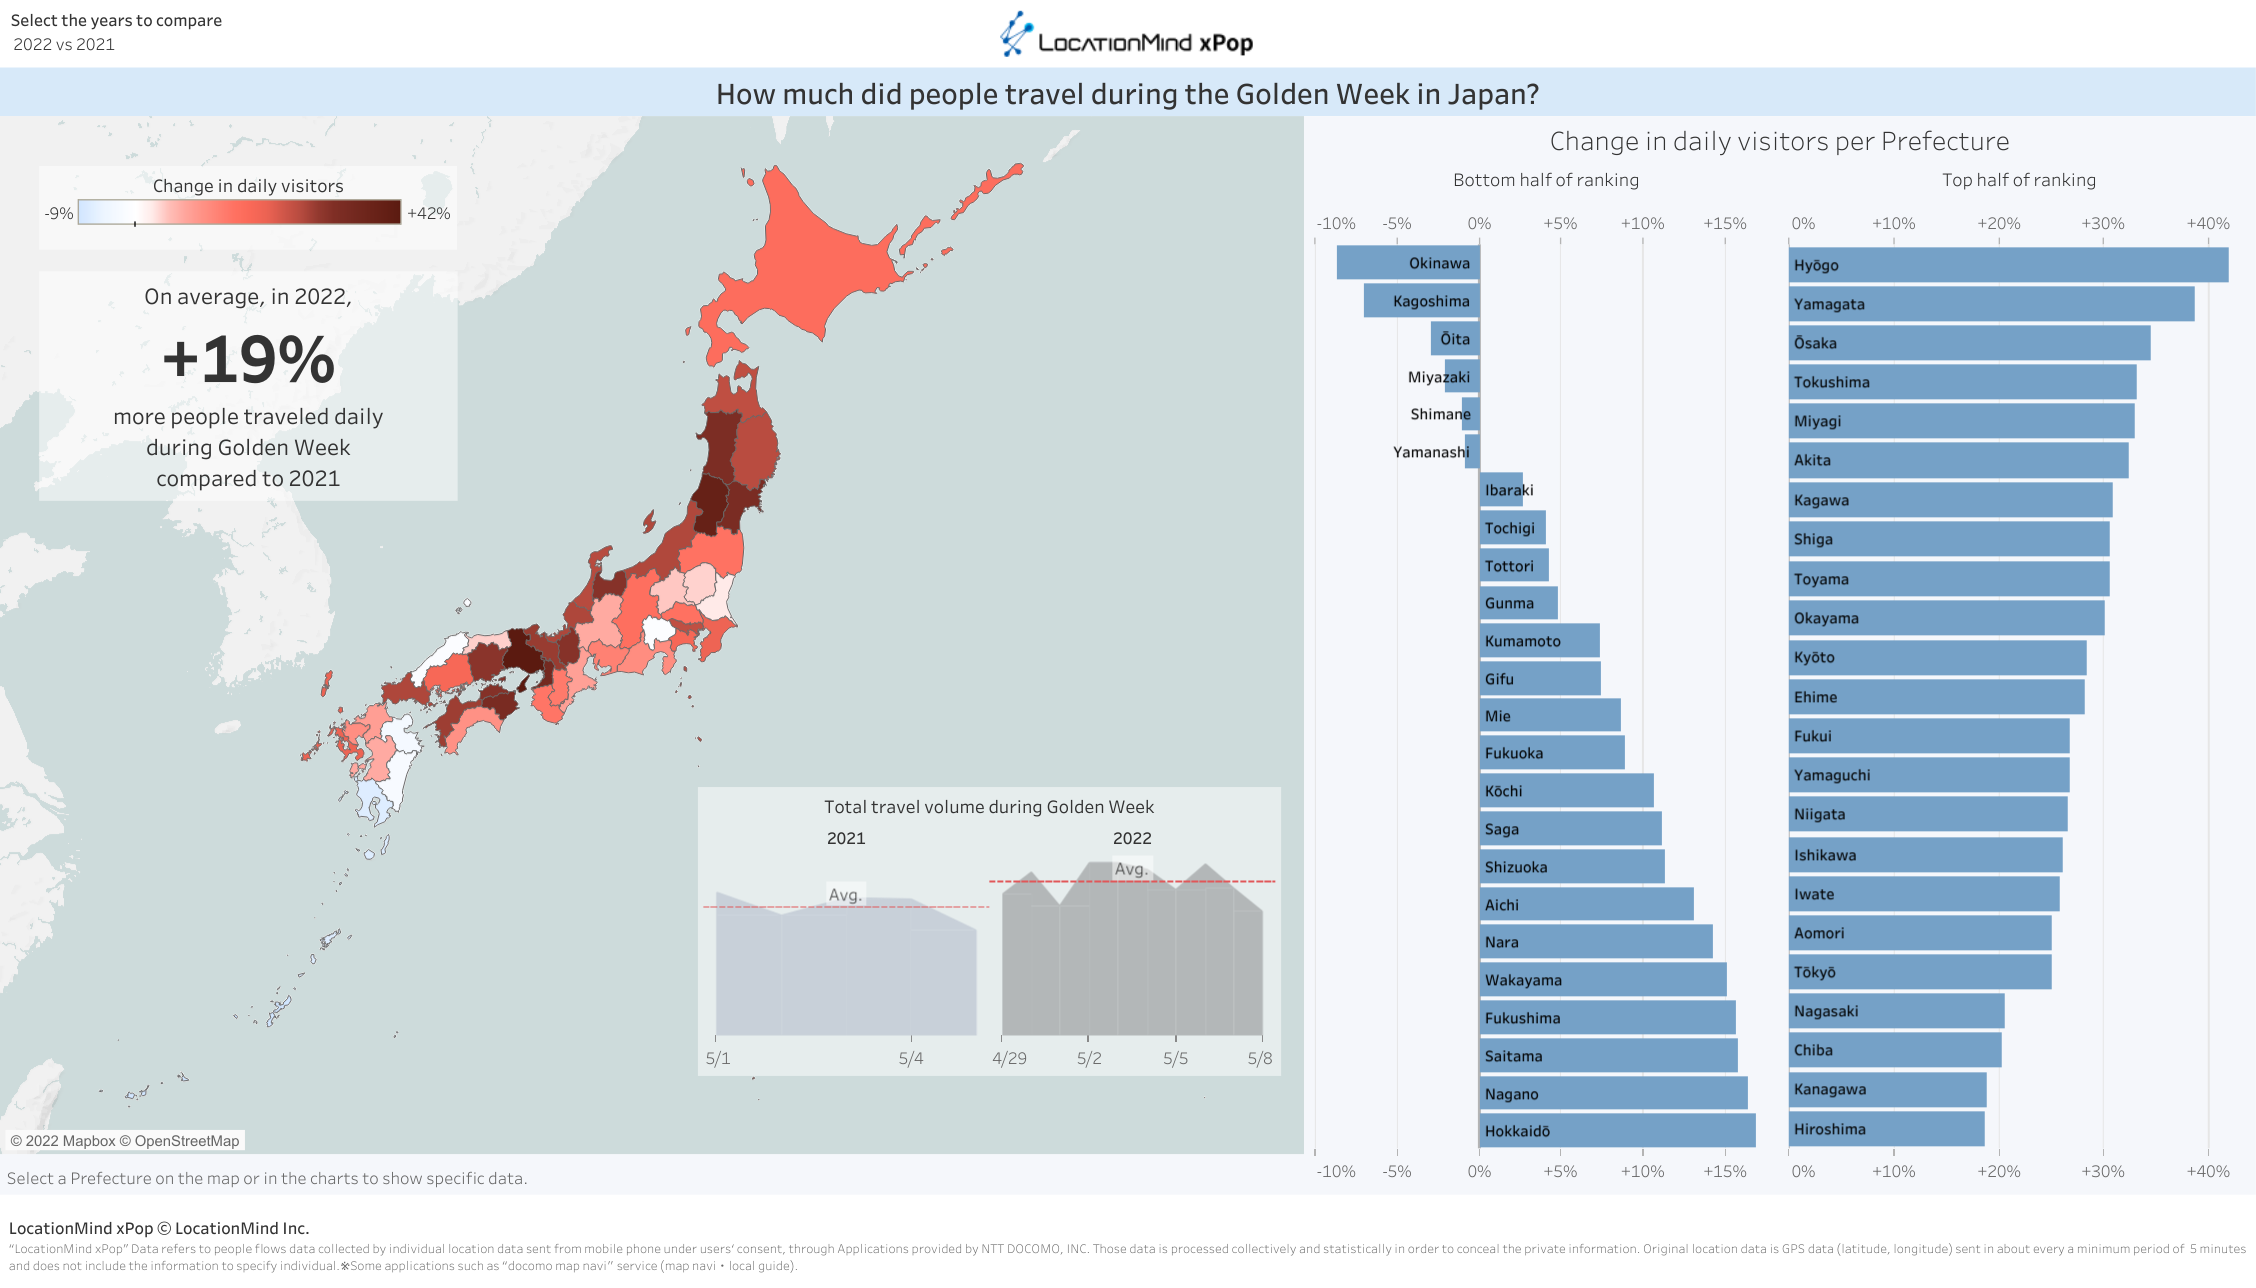
When compared to GW2021, GW2022 saw a general increase of 19% on average in the number of visitors per day nationwide. Okinawa saw a -9% decrease from the previous year, while the same analysis last year showed a significant 806.2% increase. Hokkaido marked a 436.0% increase in GW2021, and saw an additional 17% increase in GW 2022. The other major changes were seen in prefectures such as Tohoku, western coast of Japan, and Shikoku, where the percentage increase was significant. On the other hand, there were six prefectures where the number of visitors decreased from the previous year, with Okinawa, Kagoshima, Miyazaki, Oita, Shimane, and Yamanashi showing slight decreases of 9% or less.
Secondly, we compared the number of visitors to the prefectures during GW in 2022 and 2020 to determine if there was an upward trend.
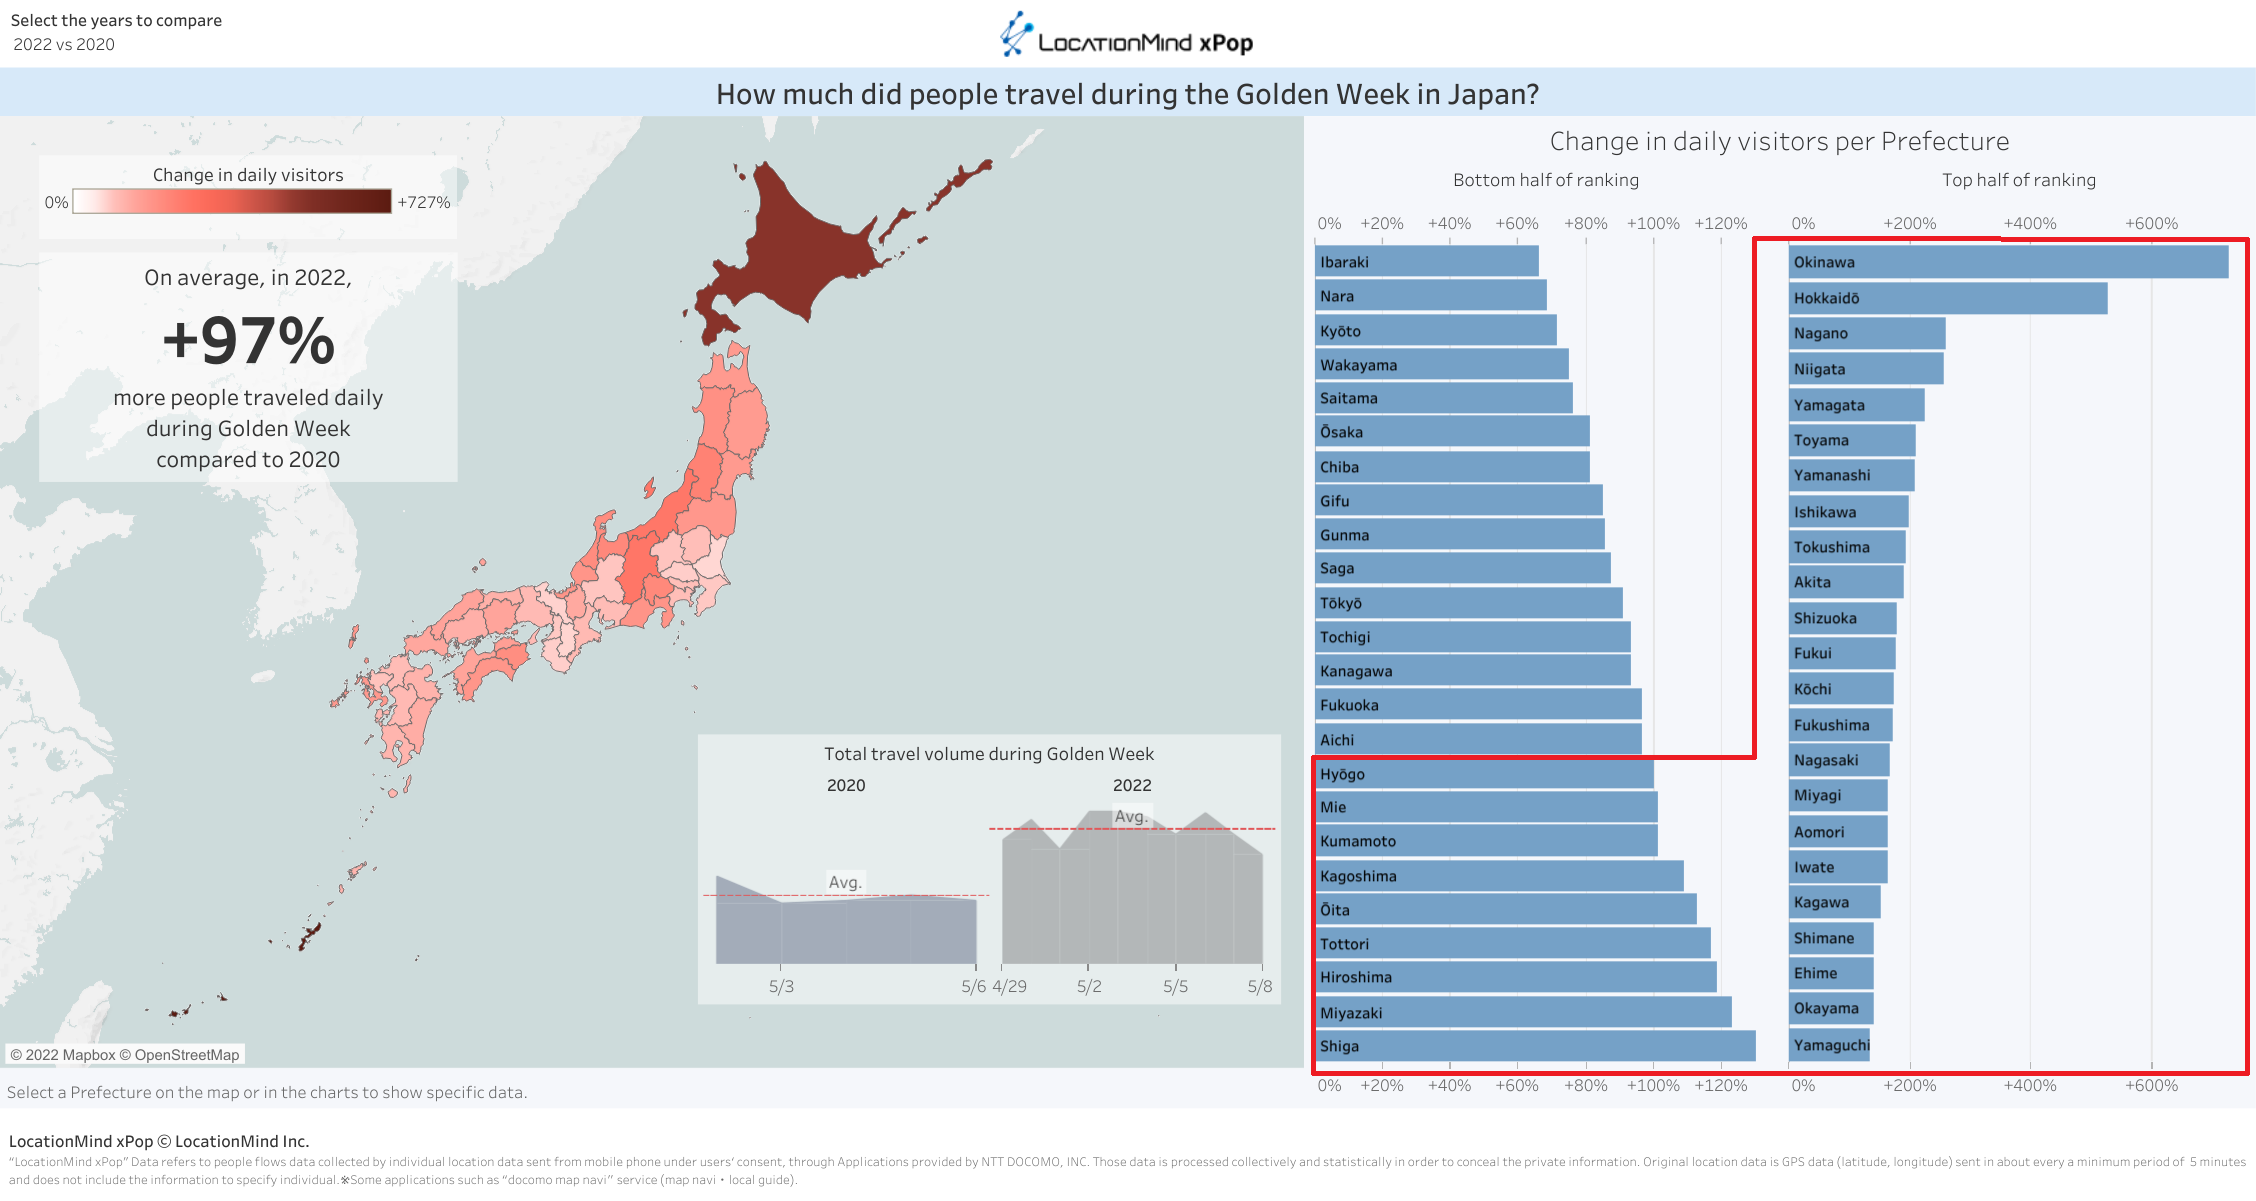
The year 2020 is the year in which COVID-19 expanded and a state of emergency was declared for all prefectures. Compared to the 2020 figures, the number of visitors per day for GW2022 increased by an average of 97% nationwide. Prefectures with the largest increases were Okinawa (727%), Hokkaido (527%), and Nagano (259%). Compared to 2020, there are no prefectures where the number has decreased, and even Ibaraki, which has the smallest rate of increase, has seen a 66% increase. There are 32 prefectures with visitor growth rates exceeding 100% (marked in red in above image), indicating that overall, movement between prefectures is becoming more active.
Overlooking the situation in 2021 and 2020 mentioned above, the number of GW travelers has increased compared to this year's situation, and the flow of people seems to have recovered sufficiently. So, can we say that 2022 has recovered to pre-coronavirus levels? Here is an interesting data comparing the number of visitors to prefectures during GW in 2019, before the spread of the COVID-19, and 2022.
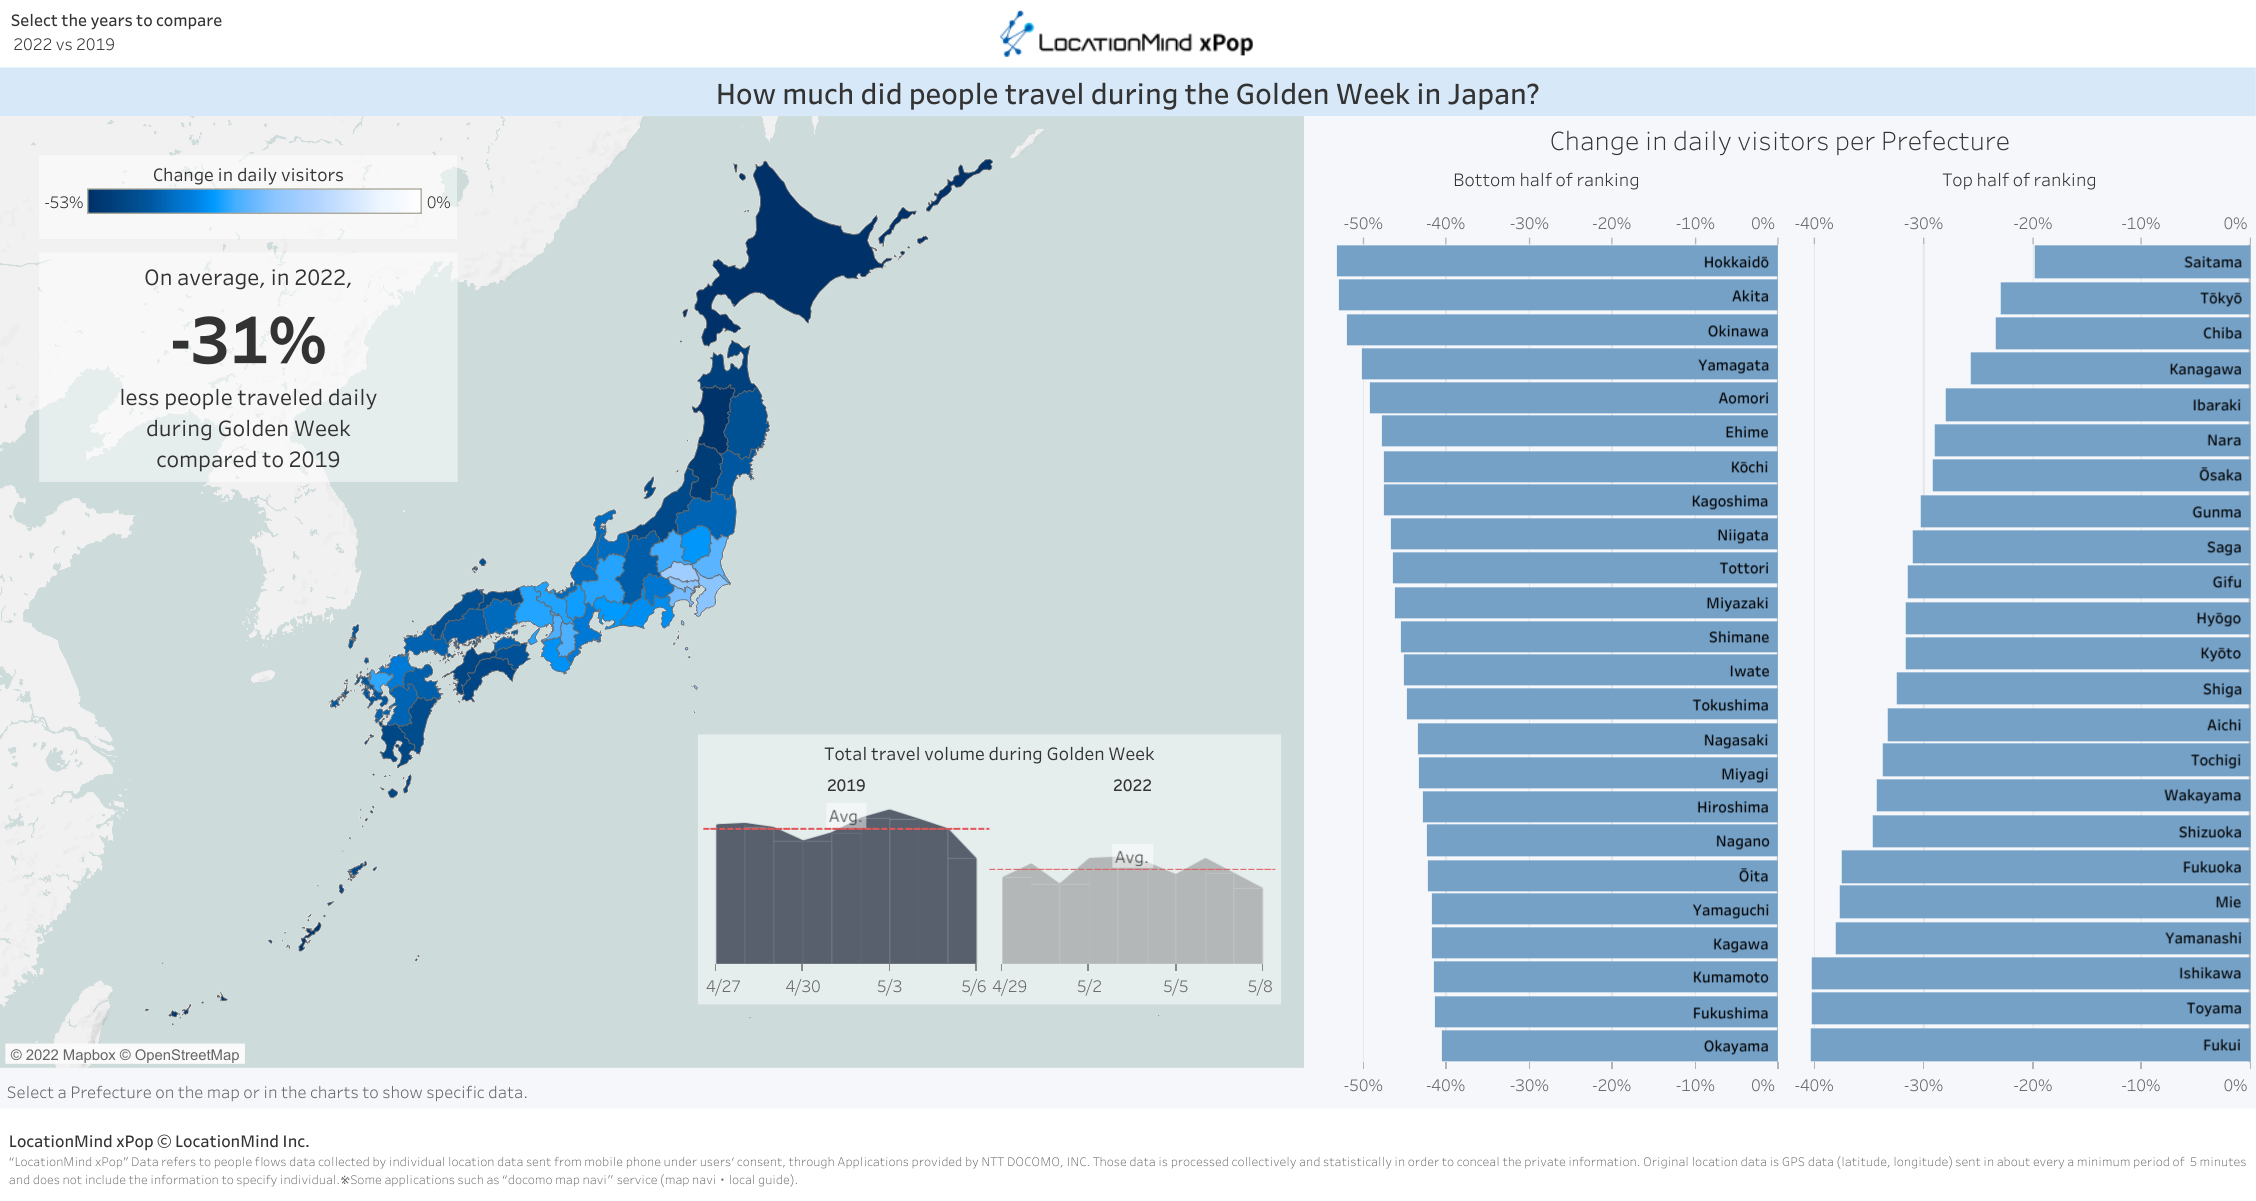
Compared to 2019, inter-prefecture travel during GW2022 decreased by -31% on average nationwide; although 2022 was a year without travel restrictions, inter-prefecture travel did not recover as much as before the COVID-19 expansion. Compared to the Tokyo metropolitan area (-23%) and the Kinki region (-31.3%) (*3), the Tohoku region (-46%), Chugoku region (-43%), and Shikoku region (-45%) show larger decreases.
(*3 ) Tokyo metropolitan area refers to Tokyo, Chiba, Saitama and Kanagawa. Kinki region refers to Hyogo, Osaka, Nara, Wakayama, Kyoto and Shiga.
As a conclusion of the survey, according to the number of inter-prefectural traffic per year, there was a sufficient recovery trend compared to the previous year in GW 2022, even several prefectures saw decreases. Looking at the trend since 2020, inter-prefecture travel is on the rise, but the number of visitors has not recovered to the level of 2019 before the expansion of COVID-19. Therefore, even if there were no restrictions such as voluntary travel restraints, the impact of the pandemic would still be felt. In addition, in areas where the number of visitors is declining, soaring fuel prices and other factors may be affecting people's movements. On the other hand, since inter-prefecture travel is on the increase year after year, tourist destinations need to be aware of the trends of people and prepare early to meet the demand for after-corona by expanding plans and tourism/transportation policies.
|
About LocationMind's services
To learn more about our basic big data processing, location analysis and people flow monitoring, |
Please refer below for last year's GW people flow analysis: https://locationmind.com/news/657-e/
To those who wish to make secondary use of this contents:
Please clearly indicate both 'Source' and 'Notes' as indicated below. If you wish to know more information, please contact us.
- Source:LocationMind Inc. Official Website
- Notes:“LocationMind xPop” Data refers to people flows data collected by individual location data sent from mobile phone under users‘ consent through applications such as “docomo map navi" service (map navi, local guide) provided by NTT DOCOMO, INC. The data is processed collectively and statistically in order to conceal the private information. Original location data is GPS data (latitude, longitude) sent at a frequency of every 5 minutes at the shortest interval and does not include information that specifies individuals.